Iteration 26 Dashboards
Project Chart
| Key Performance Indicators | Current Metric | Previous Metric |
|---|---|---|
| Project Metrics | ------------- | ----------- |
| Iterations | 27 | 26 |
| Total issues | ||
| Open issues | ||
| Closed Issues | ||
| Community Meetups | 7 | |
| Mobility rating | NA | |
| Project End Date | September 2020 | September 2020 |
| Proposed End Date | March 2025 | March 2025 |
| Engagement Metrics | ------------- | ----------- |
| GCcollab Community (members) | 191 | 189 |
| Community Meetup members | 25 | 25 |
| GCmobility ADM/DM Steering Committee | 0 | 0 |
| GCmobility Partners | 2 | 2 |
| Stakeholder Inventory | ------------- | ----------- |
| total | ||
| Active | 83 | 83 |
| Engaged | 138 | 138 |
| Potential | 77 | 77 |
| Opted-Out | 1 | 1 |
| Site Analytics | ------------- | ----------- |
| Site Pages | 10 | 10 |
| Site Posts | 28 | 25 |
| Site Discussion | 0 | 0 |
| Web Ananlytics | ------------- | ----------- |
| web_users | 37 | 4 |
| web_new_users | 32 | 3 |
| web_sessions | 50 | 6 |
| web_page_views | 91 | 11 |
| web_bounce_rate | 70 | 50 |
Resources:
Iteration 26 Dashboards
Project Chart
| Key Performance Indicators | Current Metric | Previous Metric |
|---|---|---|
Stakeholder Chart
| Key Performance Indicators | Current Metric | Previous Metric |
|---|---|---|
Engagement Chart
| Key Performance Indicators | Current Metric | Previous Metric |
|---|---|---|
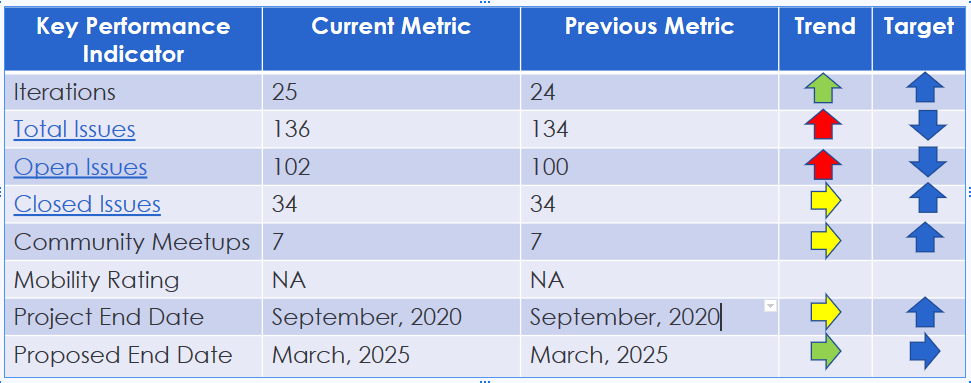
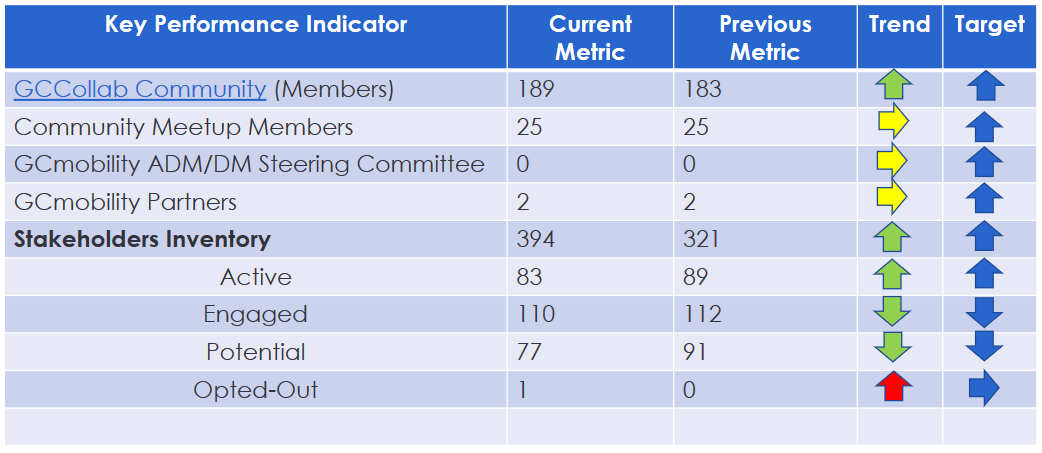
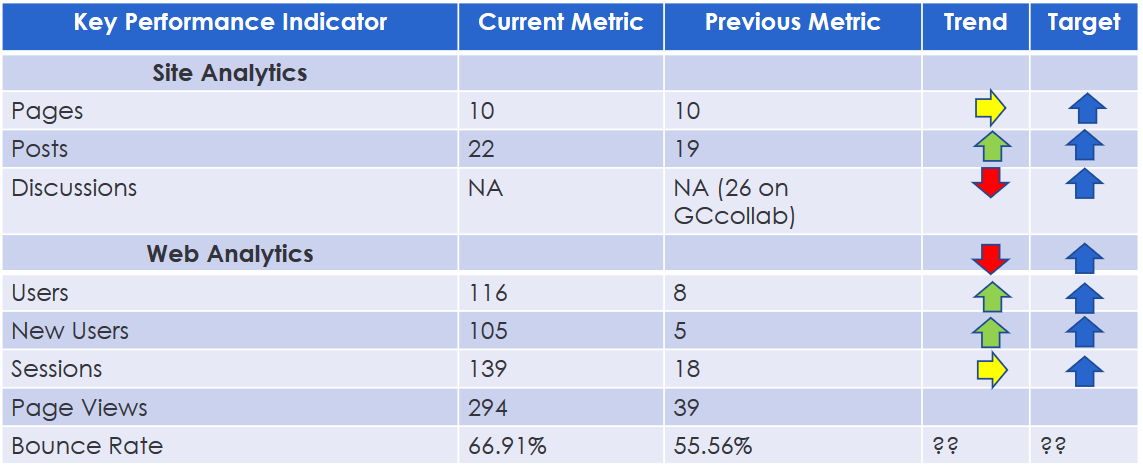
Iteration 25 Dashboards
Project Chart
 View Full Chart
Download Project Data
View Full Chart
Download Project Data
Stakeholder Chart
 View Full Chart
Download Stakeholder Data
View Full Chart
Download Stakeholder Data
Engagement Chart
 View Full Chart
Download Engagement Data
View Full Chart
Download Engagement Data
Slide deck
To Do
This is a running To Do list for improving this post:
- [ ] Develop Iteration burndown chart using D3 and Javascript
- [ ]